

Valentine’s Day is proving to be a growth driver for D2C companies with an increasing number of people flocking to D2C brands to buy gifts for their loved ones. On this note, Instamojo, the #D2CTech brand from India launched its #D2CTech Love Report to enable D2C brands to unravel and demystify the consumption potential around Valentine’s Day and thereby expand their reach. This report is an analysis of all sales and demand being created by D2C brands that use Instamojo to create their websites. Some of the key insights are as follows:

Commenting on the launch of this signature report, Sampad Swain, Co-founder & CEO, Instamojo said, “As a brand that is committed to bringing entrepreneurial passion to life, we felt this was an opportune moment to launch this report to enable these businesses access significant insights into consumer trends and gear up better in terms of future readiness. One of the most telling consumer insights from the report is how Valentine’s Day has been largely an urban phenomenon with a major proportion of the sales limited to Tier I and Tier II cities while smaller towns are yet to catch up. “
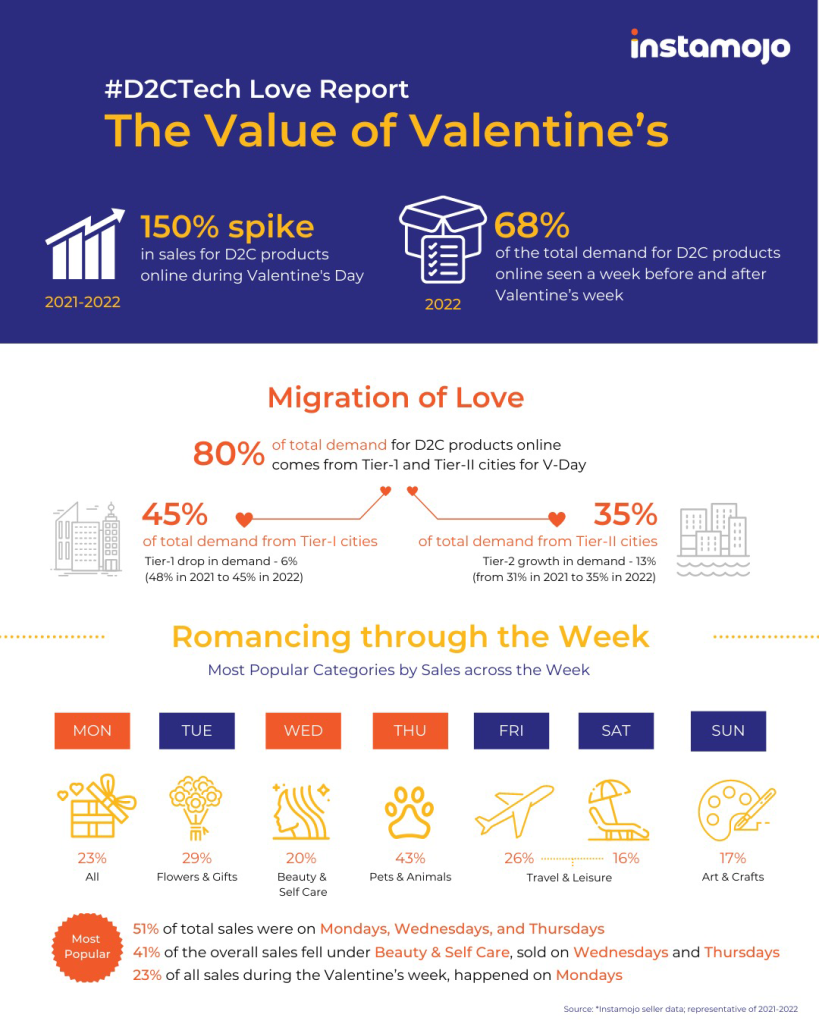
Big city love, 80% of consumer demand around Valentine’s day came in from Tier-I and Tier-II cities
- Tier-I cities have the highest demand for D2C products during Valentine’s day, contributing to 45% of the total demand in 2022. However, demand seems to be falling from Tier-I cities, recording a drop of 6% since 2021
- Tier-2 cities have the second highest demand for D2C products during valentine’s day, contributing to 35% of the total demand in 2022. Tier-2 cities seem to be slowly replacing Tier-1 cities recording a growth of 13% in demand since 2021
- Total sales during valentine’s day seem to be increasing, with the sales volumes increasing by 150% since 2021
Love is timeless, 68% of the total demand for D2C products was received a week before and after Valentine’s day
- Love is timeless, but sales might not be. While the demand for products was the highest a week before Valentine’s week, conversion of this demand to sales was the lowest with more than 2% of the consumers dropping off
- Demand to sale conversion was the highest on the week of valentine’s day and the week after. This is largely because people who finalize a product a week before valentine’s day actually buy the product on the week of valentine’s or after.
Breaking the Monday blues, 23% of all sales during Valentine’s week happened on Mondays
- Beauty and Personal Care had the highest sales on Wednesday and Thursday contributing a total of 41% to the overall sales in this category.
- Only 5% of customers chose to travel on Monday and Wednesday, in contrast to Fridays, which were preferred by 26% of customers. About 29% of the customers bought Gifts and Flowers on Tuesdays. On Thursdays, more than 40% of customers adopted Pets and Animals.
If you have an interesting Article / Report/case study to share, please get in touch with us at editors@roymediative.com/ roy@roymediative.com, 9811346846/9625243429.